I’ve recently implemented Prometheus so I can monitor my new KVM host which replaced my old VMWare ESXi hosts. It occurred to me that maybe I could monitor my APC UPS units (one on my workstation and one on my server stack) also using Prometheus.
It turns out this is readily achievable using a couple of off-the shelf open-source components:
- apcupsd - a long-standing free software (as in GPL) project which can connect to APC UPS units over USB (and other channels)
- apcupsd_exporter - a simple exporter that connects to apcupsd and exports the metrics in Prometheus format on an HTTP endpoint
It’s pretty straightforward to set this up, but there’s a couple of minor gotcha’s so the following is my write-up of how to do this.
OS
Do a fresh install of Raspbian - my build today was done on Raspbian Buster Lite 2020-02-13. Nothing special here and there are hundreds of tutorials on this as well as the Raspberry Pi official docs.
After booting up run a quick package upgrade:
sudo apt-get update && sudo apt-get upgrade -y
apcupsd
apcupsd is available as a Raspbian package so getting it is very simple:
sudo apt-get install -y apcupsd
Once installed, edit /etc/apcupsd/apcupsd.conf to suit your APC UPS model and connectivity type - see the configuration reference for details.
In my case both my UPS’s are Back-UPS 1400 units which connect via USB and the only thing I needed to change was blanking the DEVICE setting as suggested in the configuration reference:
UPSCABLE usb
UPSTYPE usb
DEVICE
LOCKFILE /var/lock
UPSCLASS standalone
UPSMODE disable
Create the systemd unit at /etc/systemd/system/apcupsd.service:
[Unit]
Description=APC UPS Power Control Daemon for Linux

[Service]
ExecStartPre=-/bin/rm -f /etc/apcupsd/powerfail
ExecStart=/sbin/apcupsd -b -f /etc/apcupsd/apcupsd.conf

[Install]
WantedBy=multi-user.target
Start the service:
sudo systemctl daemon-reload
sudo systemctl enable apcupsd
sudo systemctl start apcupsd
Test:
sudo apcaccess
apcupsd_exporter
The exporter is written in golang and there’s no official ARM build released for this so we need to build it from source:
Clone the code to your Raspberry Pi:
git clone https://github.com/mdlayher/apcupsd_exporter.git
Install the golang toolchain
sudo apt-get install golang
Note if you don’t want the golang toolchain to be sat on your Pi after installation you can remove the golang tools after the build is complete, or you could build it on another Pi, or even build it inside a Docker container.
Build the project:
go build
Run the apcupsd_exporter binary that you’ve just built to check that it works:
./apcupsd_exporter
With it running, pull metrics via curl (or your web browser):
curl https://localhost:9162/metrics
Now let’s setup a systemd unit to run the exporter when the Pi is booted. Using vi or your preferred text editor:
vi /etc/systemd/system/apcupsd_exporter.service
Define the unit as follows
[Unit]
Description=apcupsd_exporter

[Service]
TimeoutStartSec=0
ExecStart=/usr/local/bin/apcupsd_exporter

[Install]
WantedBy=multi-user.target
Now register it to be started on boot and start it:
sudo systemd daemon-reload
sudo systemd enable apcupsd_exporter
sudo systemd start apcupsd_exporter
Then verify again that metrics are being served:
curl https://localhost:9162/metrics
Prometheus Config
Back on your Prometheus server add a new job to prometheus.yml - in this example the Pi running apcupsd_exporter is at 10.0.0.99:
- job_name: "ups"
  static_configs:
    - targets: ["10.0.0.99:9162"]
Then restart Prometheus to get it to reload the config. After a few minutes metrics will be available in Prometheus.
Dashboard Definition
Here’s how I defined my UPS dashboard in Grafana to show the metrics for both my APC UPS units. I created two views - first is a minimal view which works best on the small screen I’m planning to use for my control node project:
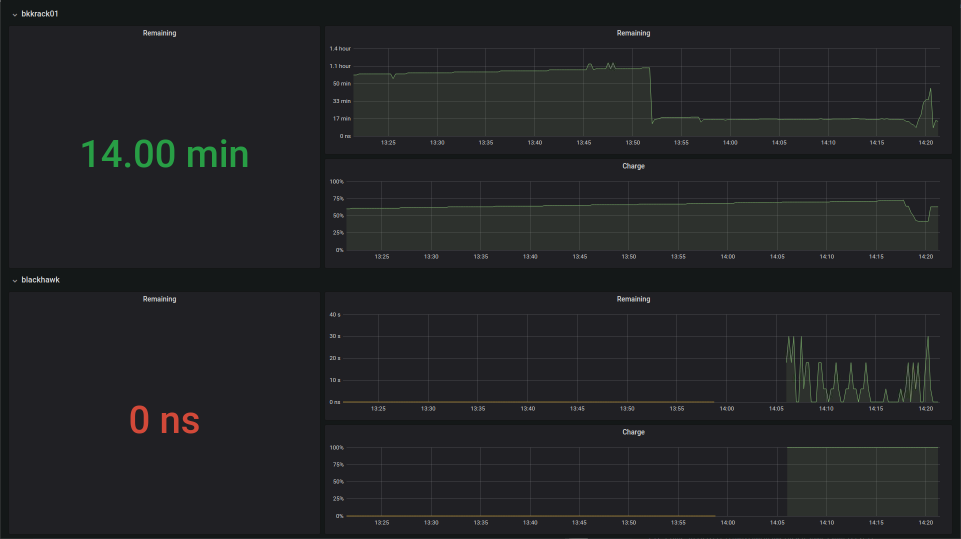
The metrics queries are:
- Remaining: apcupsd_battery_time_left_seconds{job=”ups”,ups_name=”bkkcontrol01”}
- Charge: apcupsd_battery_charge_percent{job=”ups”,ups_name=”bkkcontrol01”}
Also make sure the single-stat panels are set to Instant and show Current value not Average.
And also a detailed dashboard for seeing most of the available metrics - frankly the simple dashboard is more useful:
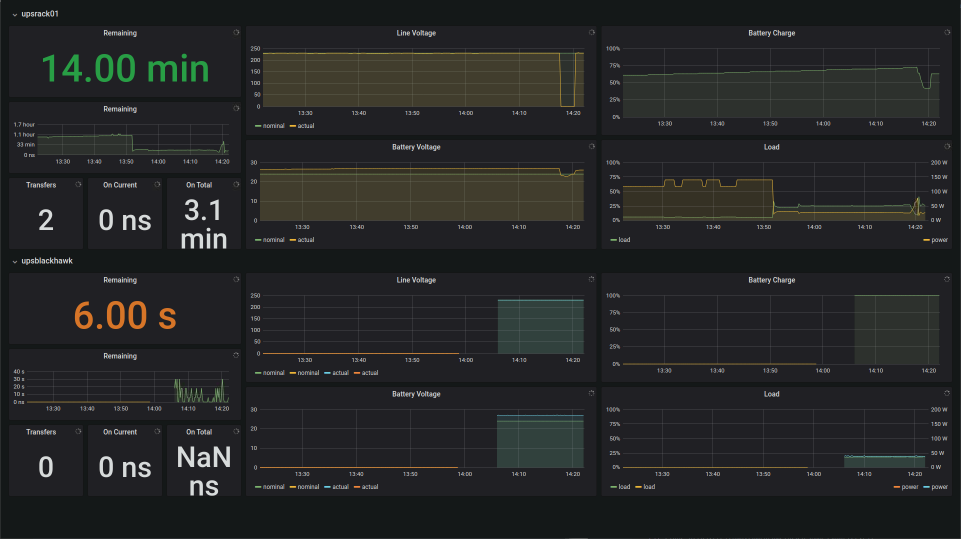
Note my the UPS on my workstation (upsblackhawk) is currently faulty which is why it’s showing only 6 seconds.